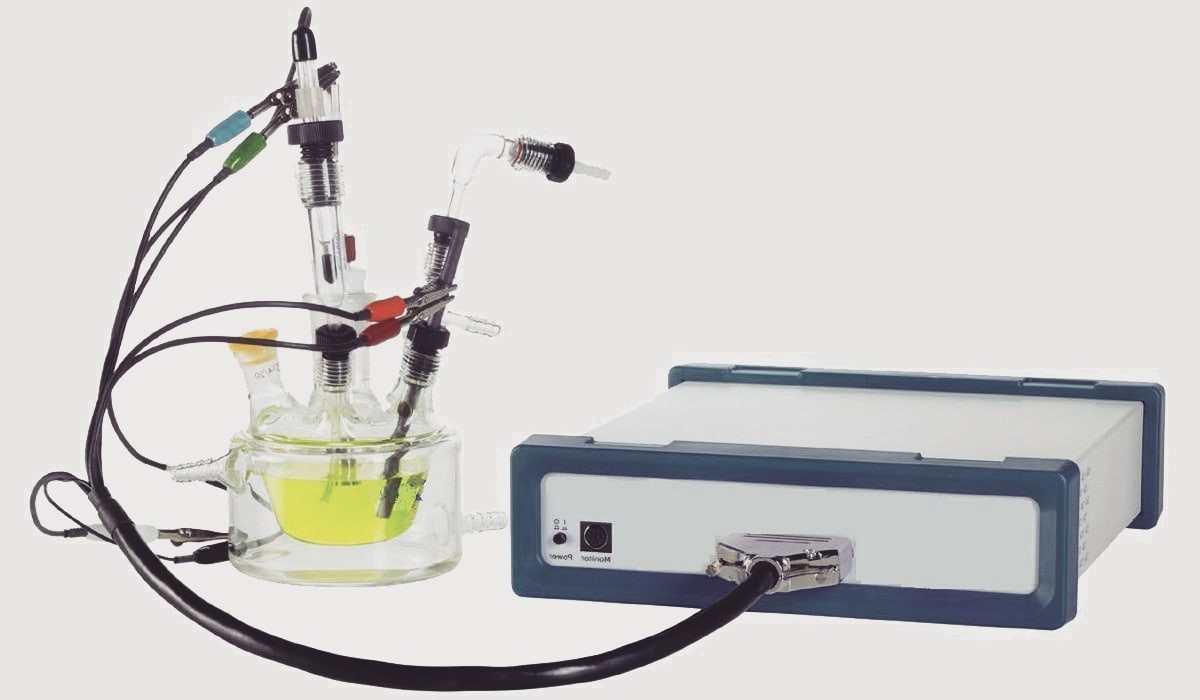
Author: Ali Kosari Mehr
Electrochemical impedance spectroscopy (EIS)
Electrochemical impedance spectroscopy is a practical means frequently utilized for assessing the corrosion behavior of materials. According to what was discussed in the last article concerning DC theory, applying a DC voltage to a circuit, one can measure the current whereby resistance is obtained by Ohm's Law. However, the following equation is used in the AC theory:
E=IZ
Where E, I, and Z are potential, current, and impedance, respectively. In fact, impedance is the AC equivalent of resistance. Impedance and resistance, both, are parameters showing the act of disrupting the flow of electrons/current. This act of disrupting is caused by resistors in the DC theory, while this act can be caused by inductors and capacitors in the AC theory. The current is shown by the following equation in the AC theory:
I(t)=A×sin(ωt+θ)
Where θ, ω, A, and t are phase shift, frequency in radians per second (2πf), maximum amplitude, and time, respectively. As evident, the nature of AC voltage is cyclic; in impedance spectroscopy, the frequency ranges from 100 kHz to several millihertz while the polarizing voltage range is typically 5.20mV relative to the open circuit potential (OCP). Considering that AC voltages and AC currents are vector quantities, impedance can be shown by a complex number in which resistance is the real part and the combination of capacitance and inductance is the imaginary part:
ITotal=I'+I''i
ETotal=E'+E''i
ZTotal=( E'+E''i)/( I'+I''i); ZTotal=Z'+Z''i
Where Z' and Z'' are real impedance and imaginary impedance, respectively. The absolute magnitude of the impedance is obtained by the following equation:
|Z|=[(Z')2+(Z'')2]1/2
tanθ= Z''/ Z'
In this regard, there are two graphs deployed for analyzing corrosion behavior by impedance spectroscopy, namely Nyquist and Bode plots. In the former one, real impedance is plotted against the absolute magnitude of imaginary impedance. In the later one, the absolute magnitude of the total impedance is plotted against phase angle θ as a function of frequency. Provided that the frequency is high, the impedance approaches RS (i.e., solution resistance). If the frequency is low, the impedance approaches RP =RS. Given RS, RP (i.e., polarization resistance) can be obtained by the following equation:
ωMax=1/(CdlRP)
Where Cdl is the capacitance of the double layer. Given RP, Cdl can be obtained approximately. Qualitatively, higher values of RP +RS culminate in greater resistance to corrosion. Evidently, the magnitude of corrosion resistance is determined by the difference between RP +RS and RS.
All in all, it must be taken into account that the corrosion behavior of non-metallic materials (e.g., ceramics) can be in a way that their Nyquist and Bode plots cannot be justified by simple electrical models (i.e., so-called equivalent circuits). For further information regarding potentiodynamic polarization, please see the reference mentioned below.
References:
Ahmad Z (2006) CONCRETE CORROSION. Princ Corros Eng Corros Control 609-646. Webpage
-
 20 Aug, 2022What is Auger electron spectroscopy?
 -
 13 Jul, 2022Classification of vacuum pumps
